- getting started
 Introduction: Cloud
- Introduction: Community
- Testsigma Community Cloud
- FAQs
- Telemetry
- Testsigma Terminology
- Testsigma Sample Applications
- collaboration
- Invite Team Members
- Users & Role Management
- Assign Projects
- Review Management [Test Cases]
- Review Management [Elements]
- Delete Users from Project
- Control Who Can Stop Execution via Usage Details and Run Results
- test cases
- Manage Test Cases
- Test Case Details, Activity & History
- Test case list actions
- Test case filters
- Import and Export Test Cases
- Import Test Cases from YAML/GIT
- Import Postman's Collections and Environments
- Test cases for Desktop Windows
- Update Test Case result in a Test Plan
- Test cases for Mobile Web Application
- Test Step Types
- Create Test Steps in Testsigma
- Type: Natural Language
- Type: REST API
- Type: Step Group
- Type: For Loop
- Type: While Loop
- Type: Block
- Type: If Condition
- Nested Step Groups
- Create Test Steps
- Create Test Steps Using Simple English
- Test Step Settings
- Test Step Actions
- Test data in steps
- Reuse Elements
- Test Step Reordering
- Bulk Actions
- Add Steps Before & After
- Web Applications
- Test Step Actions
- Test Step Settings
- Test Data in Steps
- Add Steps Manually
- Reuse Elements
- Update Elements
- Create an Element
- Reorder Test Steps
- Bulk Actions
- Add Steps Before & After
- Record steps anywhere in a Test Case
- RESTful API Testing - Overview
- API Request
- Parameters
- Body Data
- Headers
- Authorization
- Verifications
- Store Variables
- Attachments
- Stored Objects
- Image Injection
- Cross-application testing
- Test Data Management
- Test Data Types
- Raw
- Parameter
- Runtime
- Random
- Data Generator
- Phone Number
- Mail Box
- Environment
- Concat Test Data
- Create Test Data [Parameter]
- Update test data profile
- How to add value to test data profile using NLP
- Import Test Data [Parameter]
- Bulk Deletion of a Test Data Profile
- Create Test Data [Environment]
- Elements(Objects)
- Web Applications
- Record Multiple Elements[Recorder]
- Capture Single Element[Recorder]
- Create Elements [Manually]
- Supported Locator Types
- Different Strategies for Formulating Elements
- Shadow DOM Elements
- Verifying elements in Chrome DevTools
- How to Handle iframe Elements?
- android apps
- Record Multiple Elements[Recorder]
- Capture Single Element[Recorder]
- Create Elements [Manually]
- Supported Locator Types
- Different Strategies for Formulating Elements
- ios apps
- Record Multiple Elements[Recorder]
- Capture Single Element[Recorder]
- Create Elements [Manually]
- Supported Locator Types
- Different Strategies for Formulating Elements
- Using Parameter Test Data for Dynamic locators
- Using Runtime Test Data for Dynamic locators
- Using Environment Test Data for Dynamic locators
- Import/Export Elements
- test plans
- Add, Edit, Delete Test Machines
- Add, Edit, Delete Test Suites
- Schedule Test Plans
- Run Test Suites In Parallel
- Cross Browser Testing
- Distributed testing
- Headless Testing
- Test Lab Types
- Disable Test cases in Test plans
- After Test in Test Cases and Step Groups
- Post Plan Hook
- AfterTest Suite
- Email Configuration in Test Plan
- Execute Partial Test Plan Run via API
- Ad-hoc Run
- Test plan executions
- Dry Runs on Local Devices
- Run Tests on Vendor Platforms
- Run Test Plans on Local Devices
- Test Locally Hosted Applications
- Debug Test Case Failures
- Parallel and Allowed queues
- debugging
- Debug results on local devices (Web applications)
- Debug Results on Local Devices
- Launch Debugger in the Same Window
- Testsigma Agent
- Pre-requisites
- Setup: Windows, Mac, Linux
- Setup: Android Local Devices
- Setting up iOS Local Devices
- Update Agent Manually
- Update Drivers Manually
- Delete Corrupted Agent
- FAQs
- continuous integration
- Test Plan Details
- REST API(Generic)
- Jenkins
- Azure DevOps
- AWS DevOps
- AWS Lambda
- Circle CI
- Bamboo CI
- Travis CI
- CodeShip CI
- Shell Script(Generic)
- Bitrise CI
- GitHub CICD
- Bitbucket CICD
- GitLab CI/CD
- Dashboard
- visual testing
- Visual Testing
- View & Debug Results
- Update Baseline
- Visual Testing - Configure Test Cases
- desired capabilities
- Most Common Desired Capabilities List
- Enable Browser Console Debugging logs
- Geo location for Localization(L10N)
- Avoid unsafe download prompt(Chrome)
- Set geo location(latitude, longitude) Chrome & Firefox
- Custom User Profile - Chrome
- Emulate Mobile devices with Chrome Browser
- Add Chrome Extension
- Network Throttling
- Network Logs
- Biometric Authentication
- Enable app resigning in iOS
- Enable capturing screenshots for Android and iOS
- Configure Android WebViews
- Run Browser in Incognito/Private mode
- addons
- What is an Addon?
- Addons Community Marketplace
- Install Community Addon
- Prerequisites(Create/Update Addon)
- Create an Addon
- Update Addon
- Addon Types
- Create a Post Plan Hook add-on in Testsigma
- How to create OCR Text Extraction Addon
- configuration
- API Keys
- Security(SSO)
- Setting up Google Single Sign-On(SSO) login in Testsigma
- Setting Up Okta Single Sign-On Integration with SAML Login in Testsigma
- Setting up SAML-based SSO login for Testsigma in Azure
- iOS Settings
- Reset Password (Community)
- Storage Types (Community)
- uploads
- Upload Files
- Upload Android and iOS Apps
- How to generate mobile builds for Android/iOS applications?
- Testsigma REST APIs
- Environments
- Elements
- Test Plans
- Upload Files
- Get Project wide information
- Upload and update test data profile
- Trigger Multiple Test Plans
- Trigger Test Plan remotely and wait until Completion
- Run the same Test Plan multiple times in Parallel
- Schedule, Update and Delete a test plan using API
- Update Test Case results using API
- Create and update values of Test Data Profile using REST API
- Rerun Test Cases from Run Results using API
- open source dev environment setup
- macOS and IntelliJ Community Edition
- macOS and IntelliJ Ultimate Edition
- Windows and IntelliJ Ultimate Edition
- Setup Dev Environment [Addons]
- NLPs
- Unable to retrieve value stored in text element
- Unable to capture dropdown element
- Unable to Select Radiobutton
- Unable to Click Checkbox
- Why mobile device not displayed in Testsigma Mobile Test Recorder?
- Unable to create new test session due to unexpected error
Drill Down Reports in Testsigma
If the quality of an application is inversely proportional to the number of bugs / technical glitches / performance issues / usability issues, etc, then
Quality = Customer Satisfaction * ( 1/ bugs ) * (1 / usability issues )
Quality of an application reduces with more bugs.
This is where drill-down reports really come in handy. Drill-down reports let you access data at all layers. They help you understand the quality of the application and how your test automation is helping contribute to it. Drilling down can help you uncover granular details about your testing, such as
- Number of test cases failed
- Why did a specific test fail
- Number of distinct test suites with bad quality
- Which test machine is showing more bugs
Testsigma provides you an easy way to find and understand all this data.
Navigation:
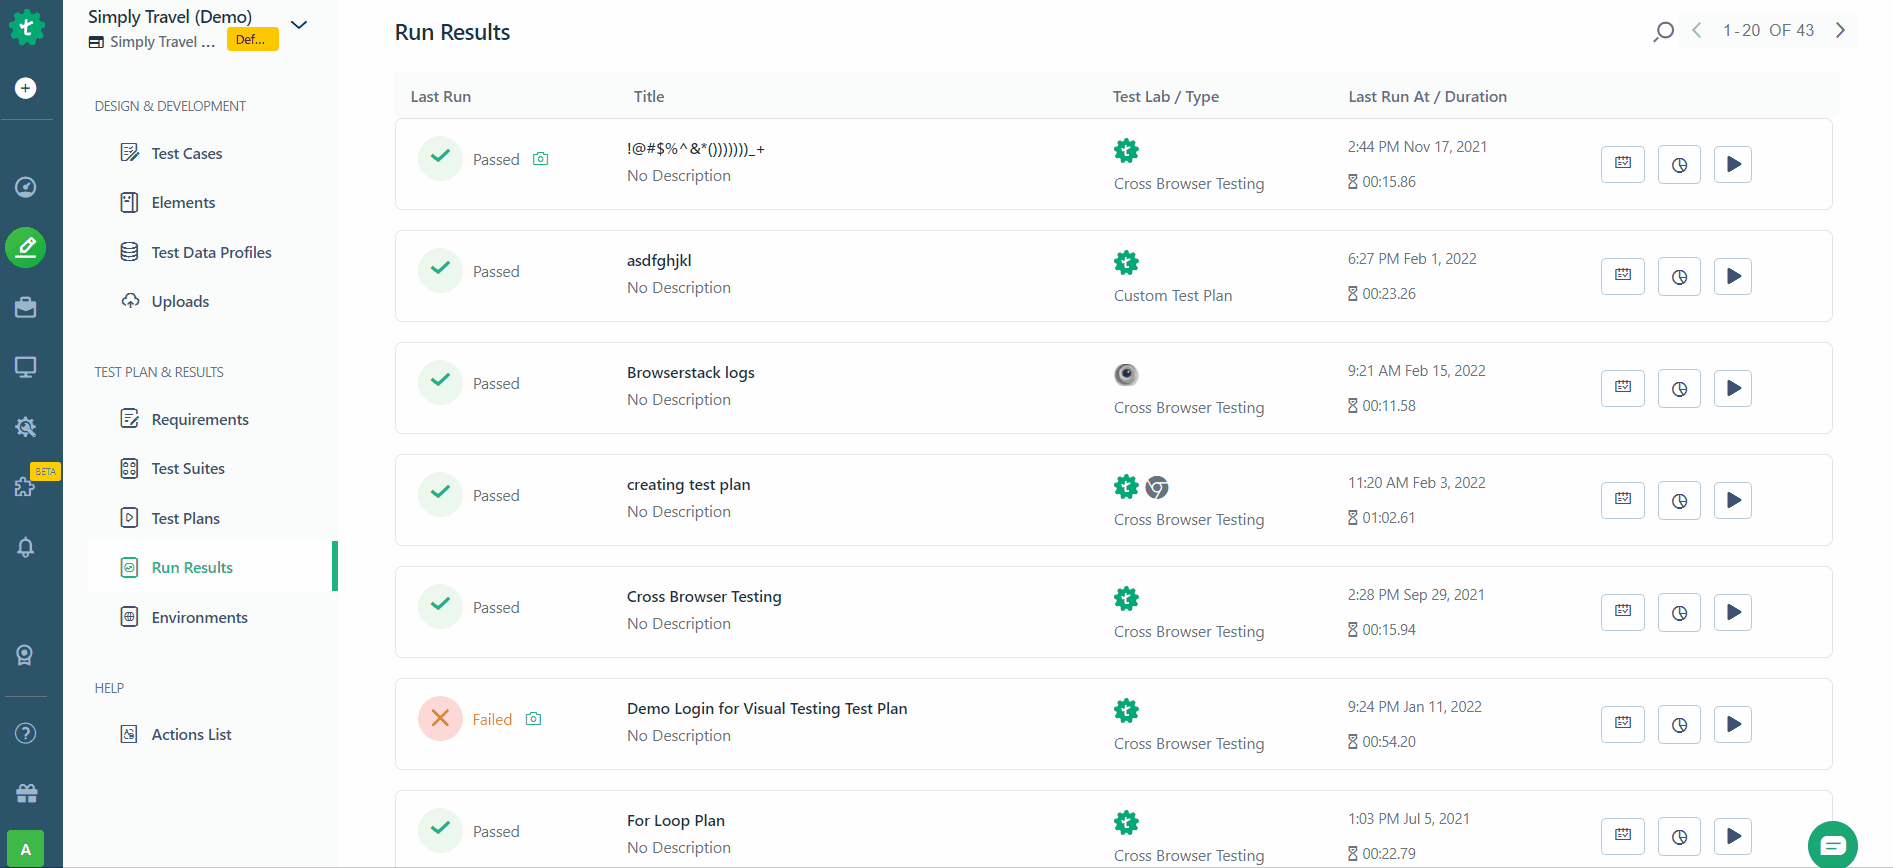
Select Project > Test Development > Run Results
How to use drill-down reports in Testsigma:
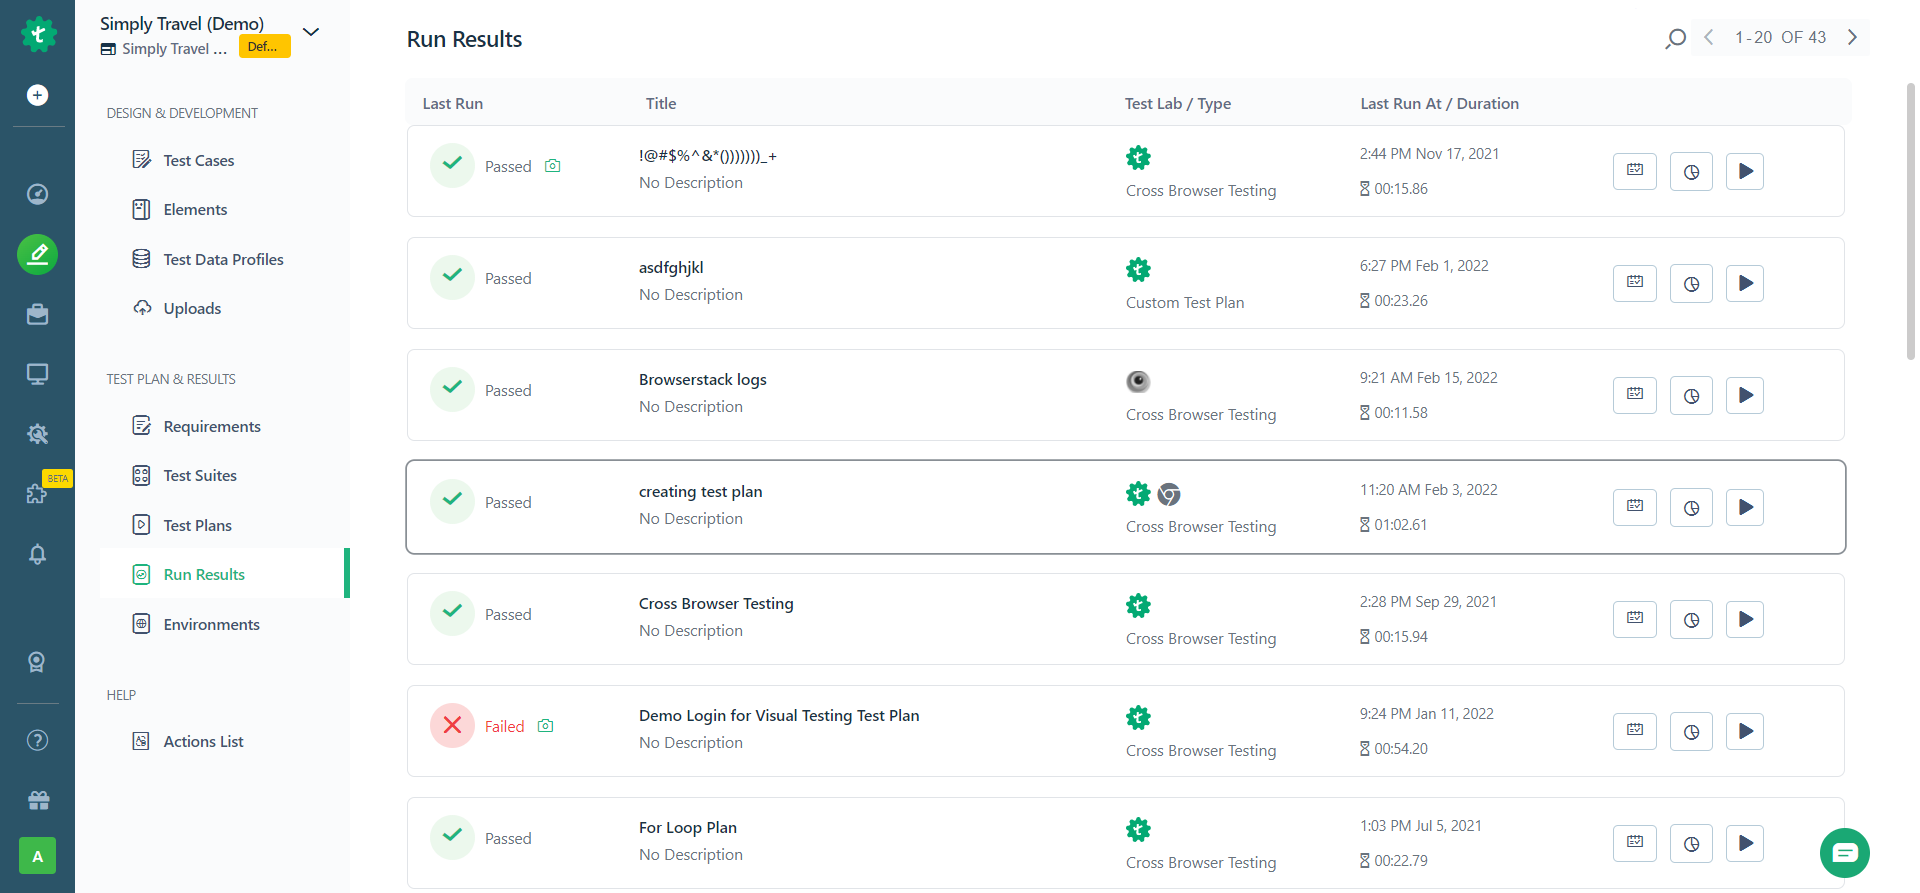
- Navigate to Run Results page.
- Click on a Test Plan Result. The test plan result page will look like this:
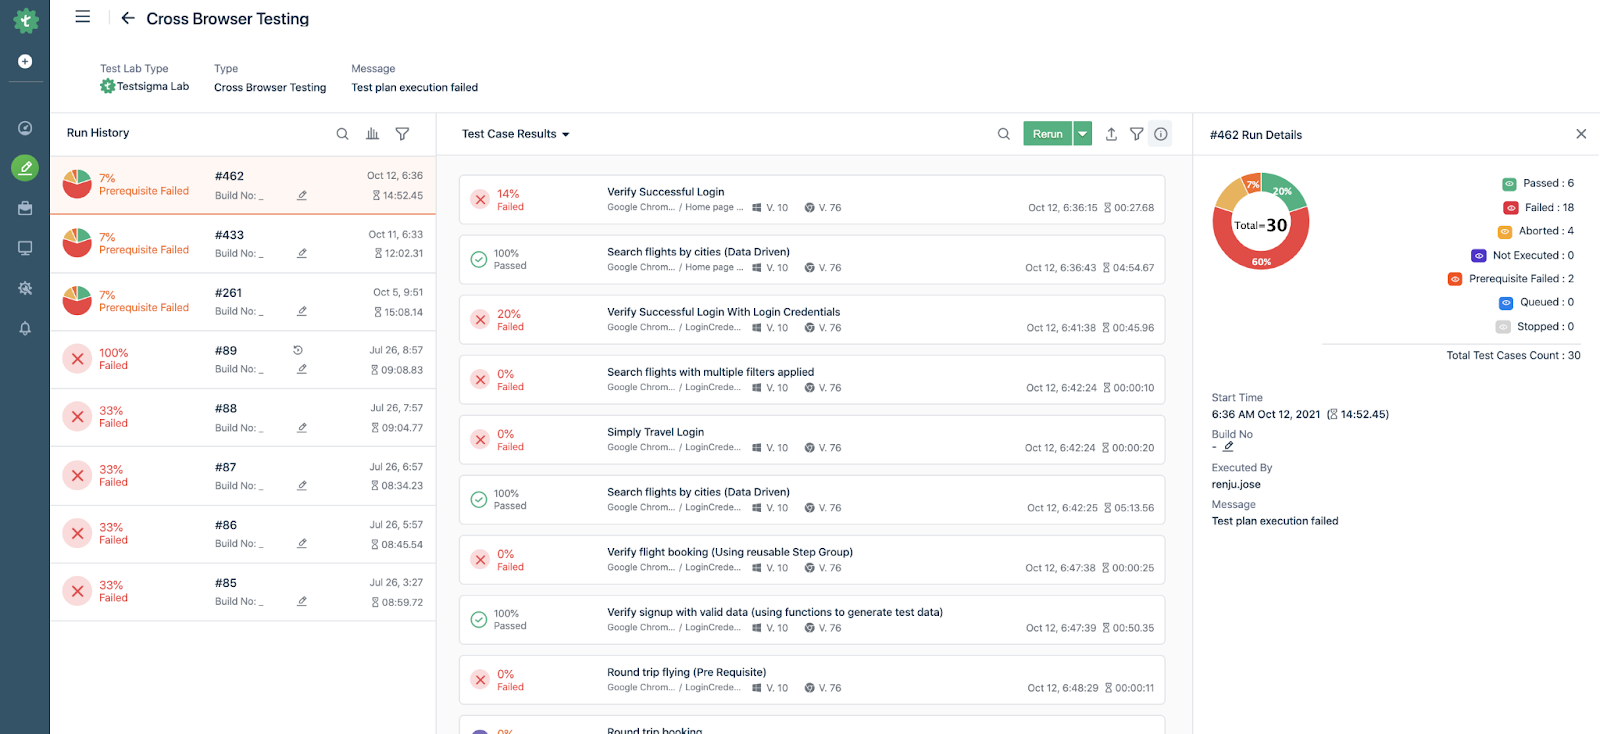
- Click on a test case. OR if you choose Test suites from the drop-down, click on a test suite. This is how results will appear if you choose ‘Test Suite Results.
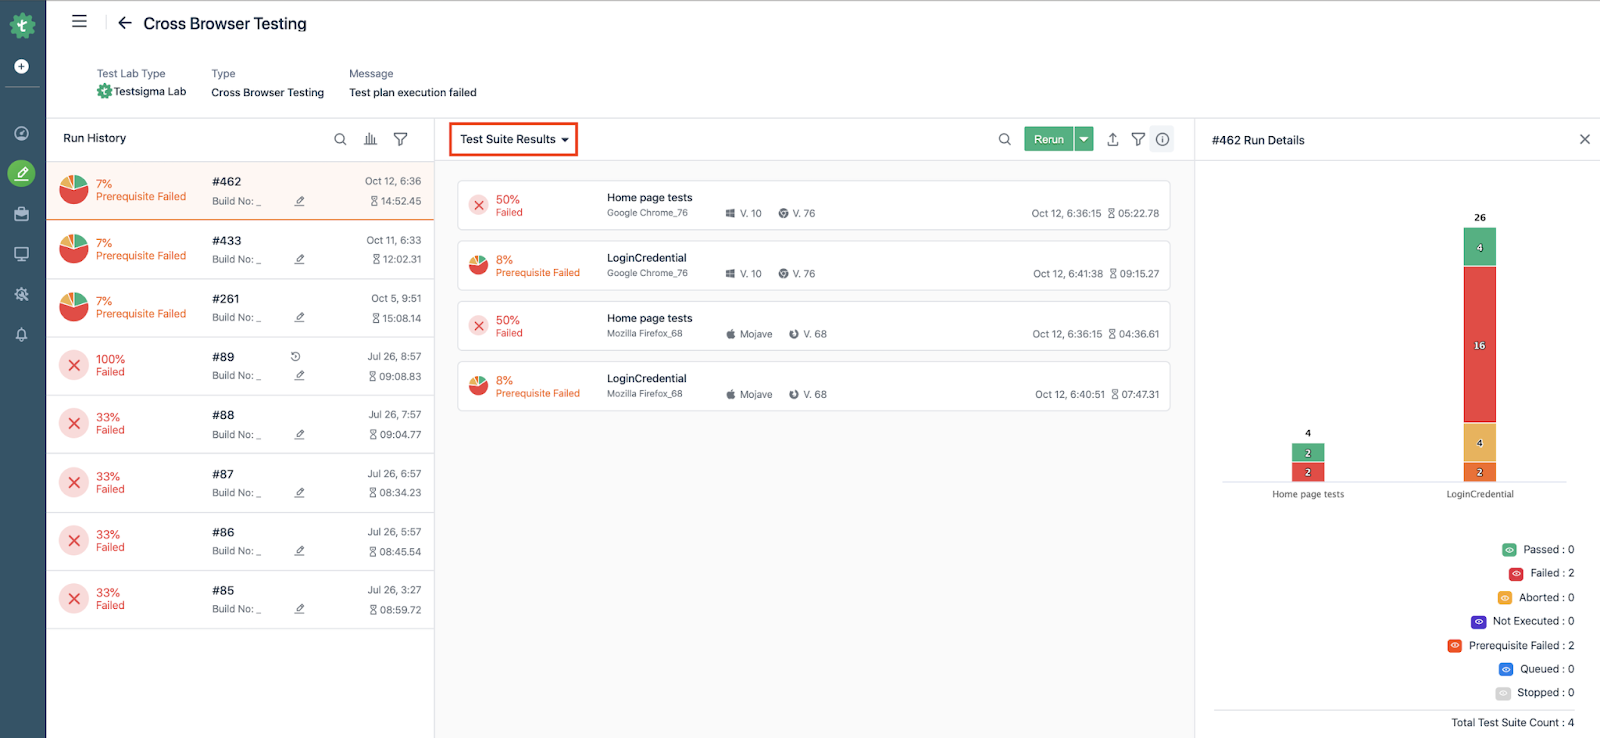
- The right side of the screen shows the test results for a specific test suite or a test machine.
- Choose the different build numbers on the left side, under Run History, to view how the results have changed over time
See the steps above in action in the gif below: