- getting started
 Introduction: Cloud
- Introduction: Community
- Testsigma Community Cloud
- FAQs
- Telemetry
- Testsigma Terminology
- Testsigma Sample Applications
- collaboration
- Invite Team Members
- Users & Role Management
- Assign Projects
- Review Management [Test Cases]
- Review Management [Elements]
- Delete Users from Project
- Control Who Can Stop Execution via Usage Details and Run Results
- test cases
- Manage Test Cases
- Test Case Details, Activity & History
- Test case list actions
- Test case filters
- Import and Export Test Cases
- Import Test Cases from YAML/GIT
- Import Postman's Collections and Environments
- Test cases for Desktop Windows
- Update Test Case result in a Test Plan
- Test cases for Mobile Web Application
- Test Step Types
- Create Test Steps in Testsigma
- Type: Natural Language
- Type: REST API
- Type: Step Group
- Type: For Loop
- Type: While Loop
- Type: Block
- Type: If Condition
- Nested Step Groups
- Create Test Steps
- Create Test Steps Using Simple English
- Test Step Settings
- Test Step Actions
- Test data in steps
- Reuse Elements
- Test Step Reordering
- Bulk Actions
- Add Steps Before & After
- Web Applications
- Test Step Actions
- Test Step Settings
- Test Data in Steps
- Add Steps Manually
- Reuse Elements
- Update Elements
- Create an Element
- Reorder Test Steps
- Bulk Actions
- Add Steps Before & After
- Record steps anywhere in a Test Case
- RESTful API Testing - Overview
- API Request
- Parameters
- Body Data
- Headers
- Authorization
- Verifications
- Store Variables
- Attachments
- Stored Objects
- Image Injection
- Cross-application testing
- Test Data Management
- Test Data Types
- Raw
- Parameter
- Runtime
- Random
- Data Generator
- Phone Number
- Mail Box
- Environment
- Concat Test Data
- Create Test Data [Parameter]
- Update test data profile
- How to add value to test data profile using NLP
- Import Test Data [Parameter]
- Bulk Deletion of a Test Data Profile
- Create Test Data [Environment]
- Elements(Objects)
- Web Applications
- Record Multiple Elements[Recorder]
- Capture Single Element[Recorder]
- Create Elements [Manually]
- Supported Locator Types
- Different Strategies for Formulating Elements
- Shadow DOM Elements
- Verifying elements in Chrome DevTools
- How to Handle iframe Elements?
- android apps
- Record Multiple Elements[Recorder]
- Capture Single Element[Recorder]
- Create Elements [Manually]
- Supported Locator Types
- Different Strategies for Formulating Elements
- ios apps
- Record Multiple Elements[Recorder]
- Capture Single Element[Recorder]
- Create Elements [Manually]
- Supported Locator Types
- Different Strategies for Formulating Elements
- Using Parameter Test Data for Dynamic locators
- Using Runtime Test Data for Dynamic locators
- Using Environment Test Data for Dynamic locators
- Import/Export Elements
- test plans
- Add, Edit, Delete Test Machines
- Add, Edit, Delete Test Suites
- Schedule Test Plans
- Run Test Suites In Parallel
- Cross Browser Testing
- Distributed testing
- Headless Testing
- Test Lab Types
- Disable Test cases in Test plans
- After Test in Test Cases and Step Groups
- Post Plan Hook
- AfterTest Suite
- Email Configuration in Test Plan
- Execute Partial Test Plan Run via API
- Ad-hoc Run
- Test plan executions
- Dry Runs on Local Devices
- Run Tests on Vendor Platforms
- Run Test Plans on Local Devices
- Test Locally Hosted Applications
- Debug Test Case Failures
- Parallel and Allowed queues
- debugging
- Debug results on local devices (Web applications)
- Debug Results on Local Devices
- Launch Debugger in the Same Window
- Testsigma Agent
- Pre-requisites
- Setup: Windows, Mac, Linux
- Setup: Android Local Devices
- Setting up iOS Local Devices
- Update Agent Manually
- Update Drivers Manually
- Delete Corrupted Agent
- FAQs
- continuous integration
- Test Plan Details
- REST API(Generic)
- Jenkins
- Azure DevOps
- AWS DevOps
- AWS Lambda
- Circle CI
- Bamboo CI
- Travis CI
- CodeShip CI
- Shell Script(Generic)
- Bitrise CI
- GitHub CICD
- Bitbucket CICD
- GitLab CI/CD
- Dashboard
- visual testing
- Visual Testing
- View & Debug Results
- Update Baseline
- Visual Testing - Configure Test Cases
- desired capabilities
- Most Common Desired Capabilities List
- Enable Browser Console Debugging logs
- Geo location for Localization(L10N)
- Avoid unsafe download prompt(Chrome)
- Set geo location(latitude, longitude) Chrome & Firefox
- Custom User Profile - Chrome
- Emulate Mobile devices with Chrome Browser
- Add Chrome Extension
- Network Throttling
- Network Logs
- Biometric Authentication
- Enable app resigning in iOS
- Enable capturing screenshots for Android and iOS
- Configure Android WebViews
- Run Browser in Incognito/Private mode
- addons
- What is an Addon?
- Addons Community Marketplace
- Install Community Addon
- Prerequisites(Create/Update Addon)
- Create an Addon
- Update Addon
- Addon Types
- Create a Post Plan Hook add-on in Testsigma
- How to create OCR Text Extraction Addon
- configuration
- API Keys
- Security(SSO)
- Setting up Google Single Sign-On(SSO) login in Testsigma
- Setting Up Okta Single Sign-On Integration with SAML Login in Testsigma
- Setting up SAML-based SSO login for Testsigma in Azure
- iOS Settings
- Reset Password (Community)
- Storage Types (Community)
- uploads
- Upload Files
- Upload Android and iOS Apps
- How to generate mobile builds for Android/iOS applications?
- Testsigma REST APIs
- Environments
- Elements
- Test Plans
- Upload Files
- Get Project wide information
- Upload and update test data profile
- Trigger Multiple Test Plans
- Trigger Test Plan remotely and wait until Completion
- Run the same Test Plan multiple times in Parallel
- Schedule, Update and Delete a test plan using API
- Update Test Case results using API
- Create and update values of Test Data Profile using REST API
- Rerun Test Cases from Run Results using API
- open source dev environment setup
- macOS and IntelliJ Community Edition
- macOS and IntelliJ Ultimate Edition
- Windows and IntelliJ Ultimate Edition
- Setup Dev Environment [Addons]
- NLPs
- Unable to retrieve value stored in text element
- Unable to capture dropdown element
- Unable to Select Radiobutton
- Unable to Click Checkbox
- Why mobile device not displayed in Testsigma Mobile Test Recorder?
- Unable to create new test session due to unexpected error
Debug Results on Local Devices
There might be times when you face an issue during your test execution, and you need more than screenshots, videos, or logs to see where the error was. With Testsigma, now you can debug any such issues on your local devices via step-wise debugging. In this document we will discuss how to do that.
Prerequisites
- A mobile app test case to debug. To know more on how to create a test case for mobile, check here
-
A local mobile device configured to run with Testsigma. Here are two links that would help:
Steps
- Go to the test case that you want to debug on your local device.
- On the test case details page, click on the downward arrow beside the run button on the top right of the page. For your reference, the downward arrow is also highlighted in the screenshot below:
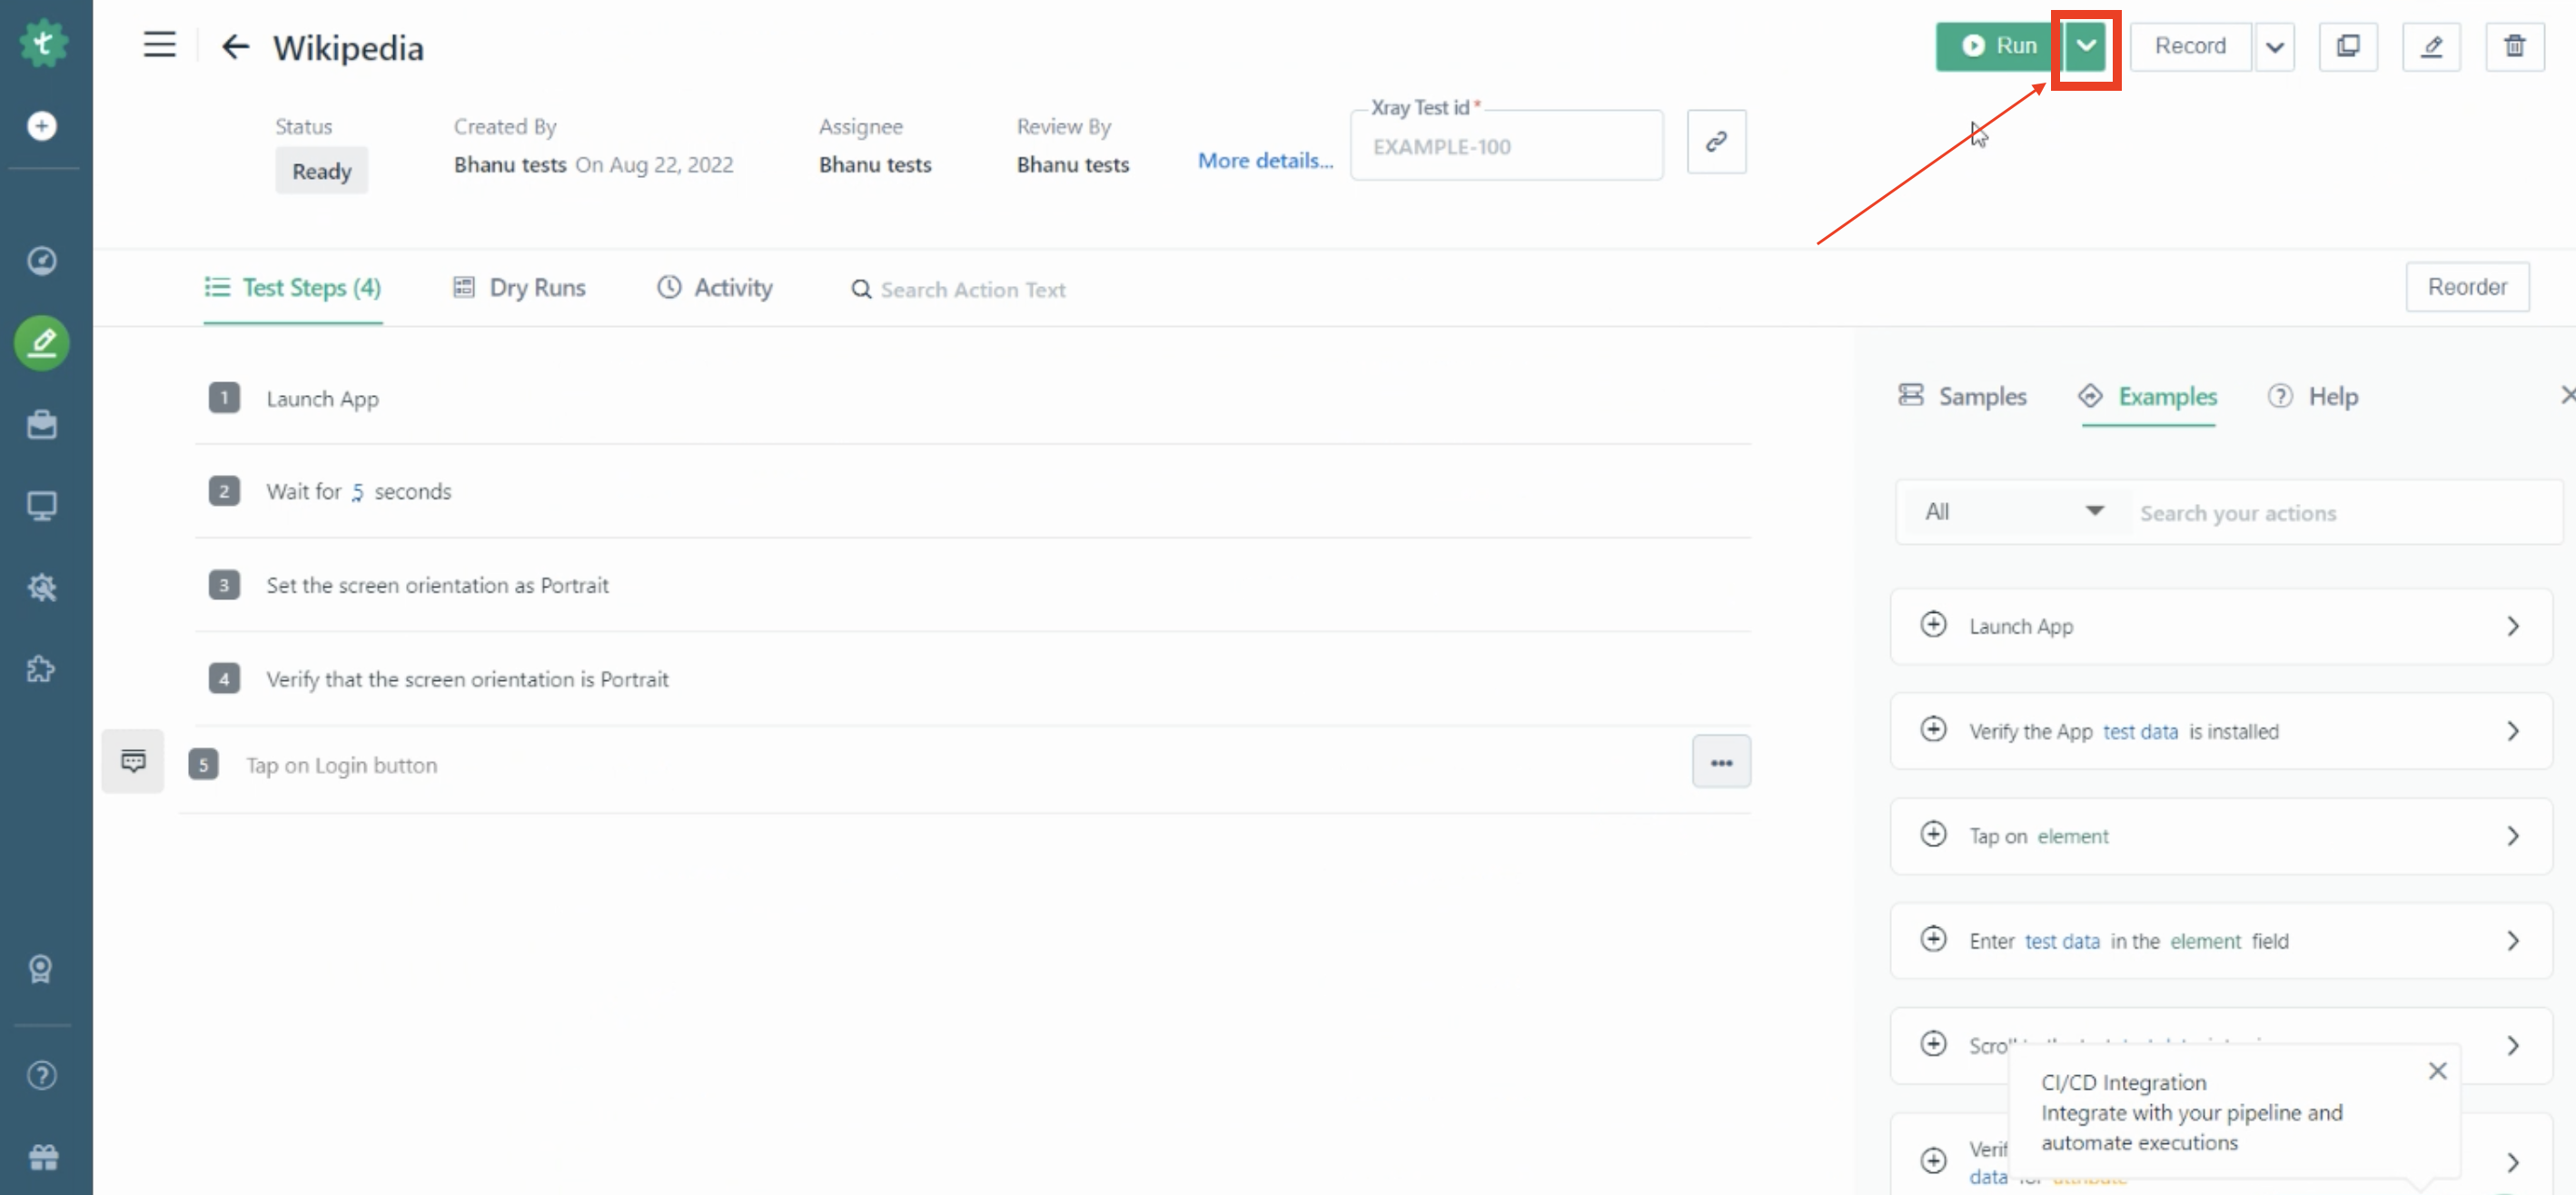
- You will see two options in the drop-down that appears, choose the option Run In Debug Mode.
- The Ad-hoc Run layover will appear as also shown in the screenshot below.
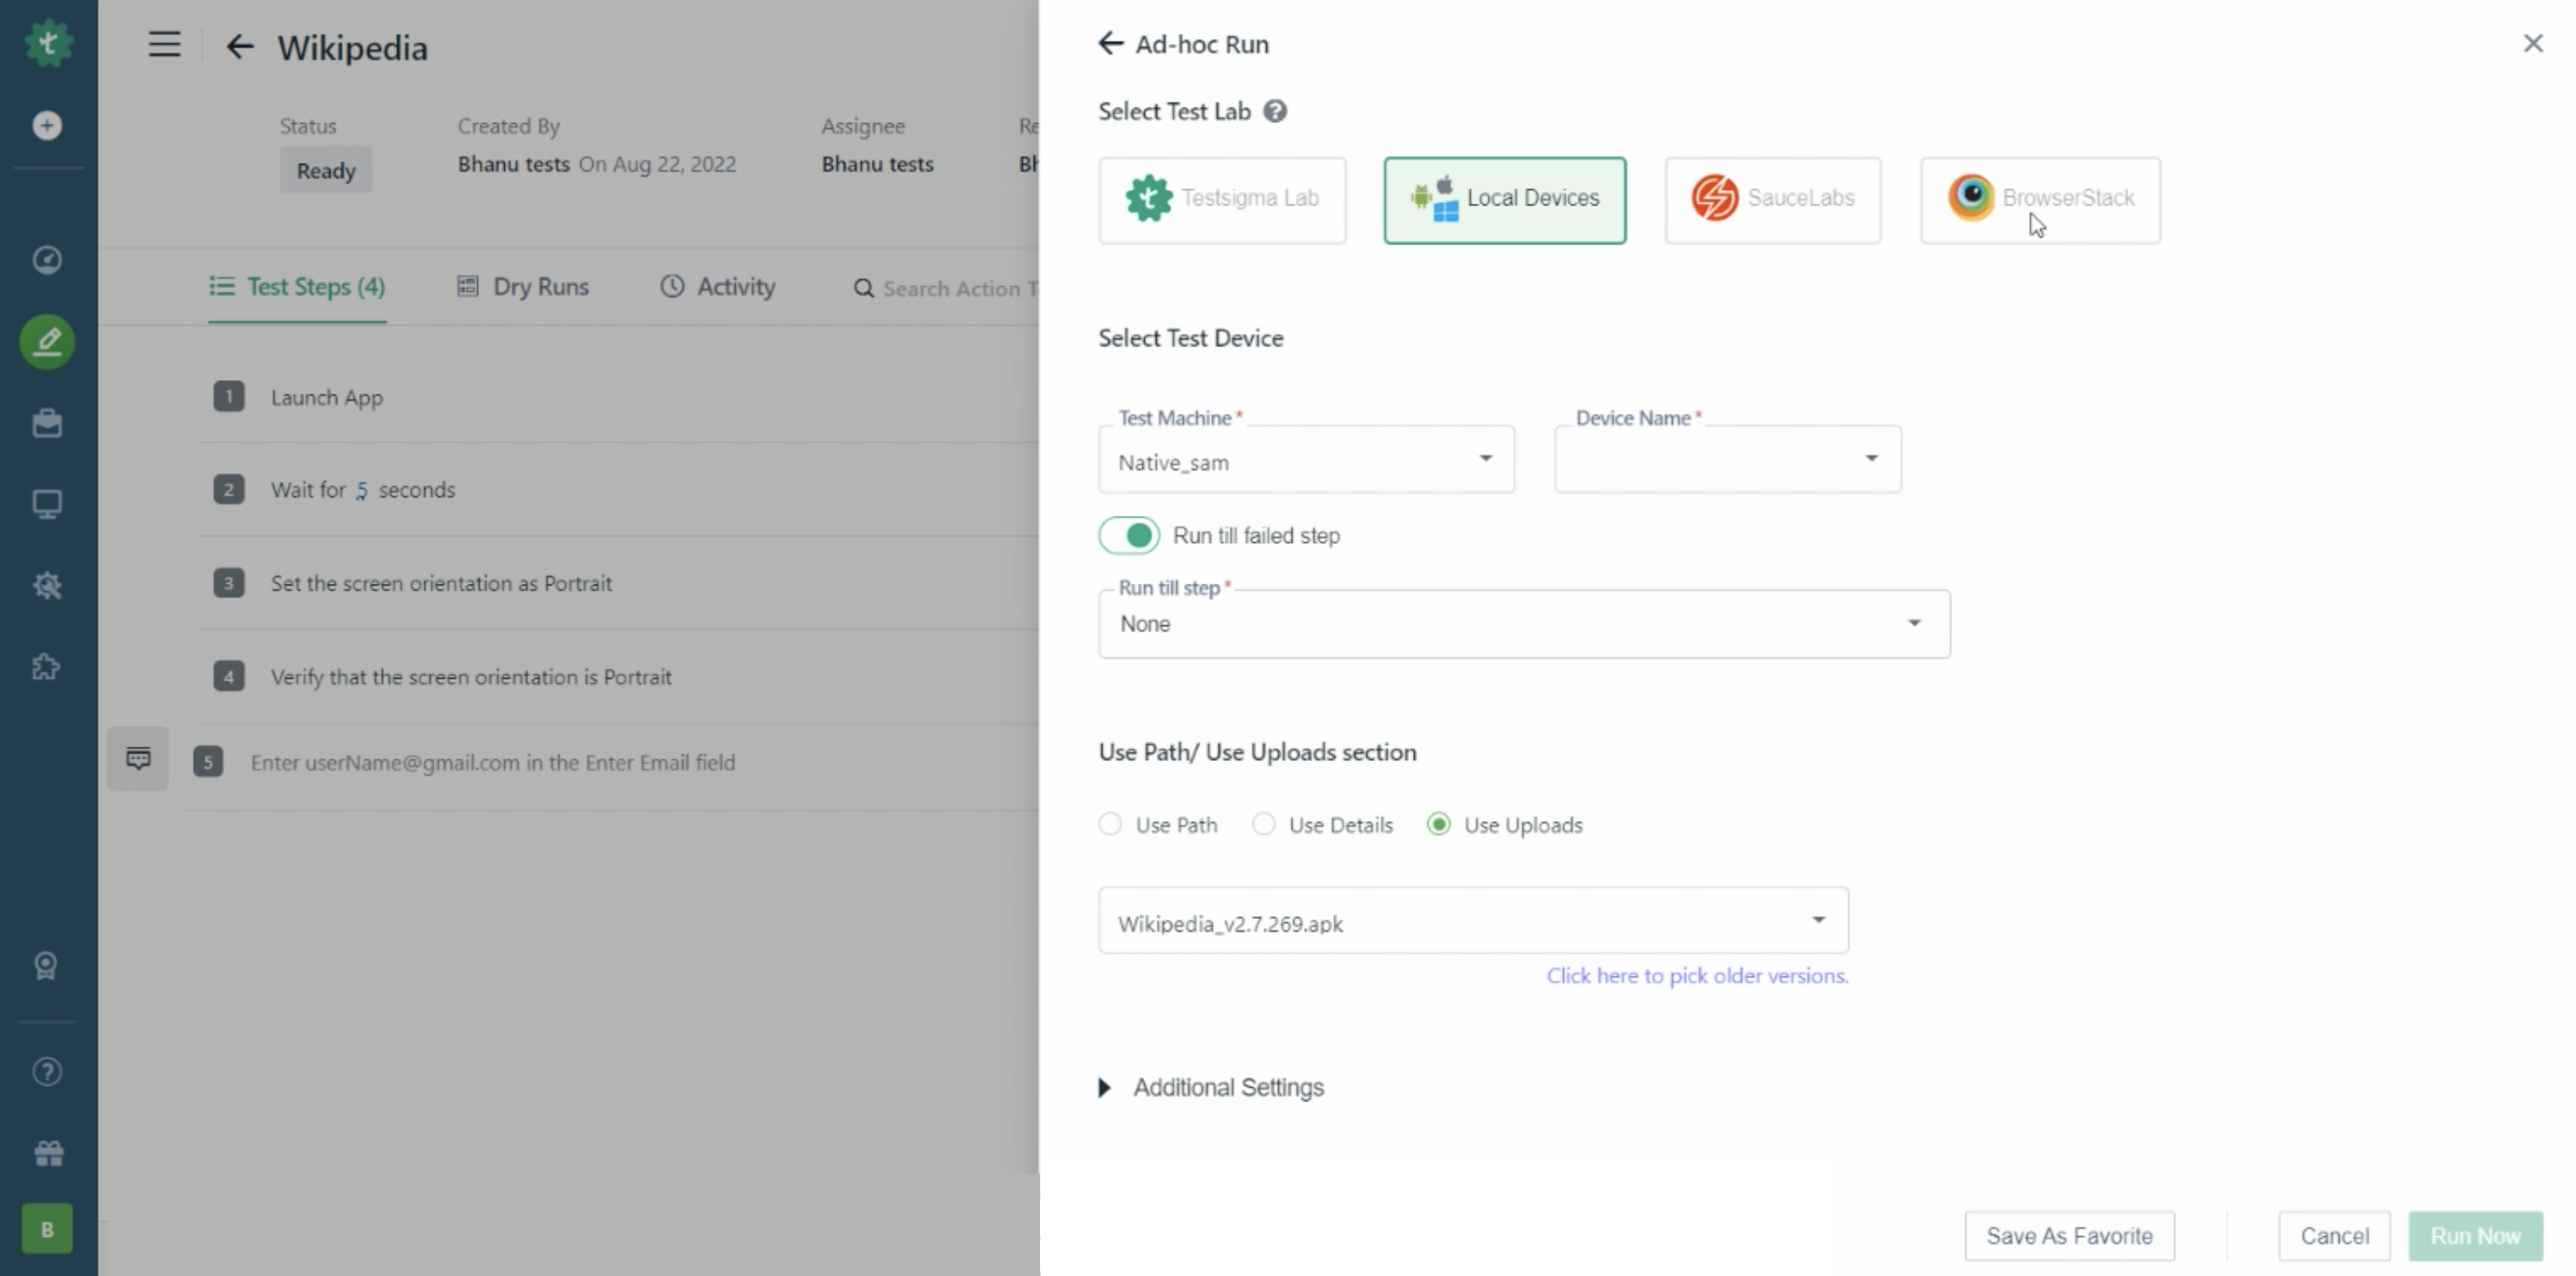
- On this layover, make sure the Test Lab is selected as Local Devices. Select the Test Device by choosing the Test Machine and Device Name.
- If you want the test cases to execute till the step that fails, then you have to enable toggle Run till failed step.
Or, if you want the test cases to execute till a particular step then you can choose that step from the dropdown with label Run till step.
If you enable the toggle Run till failed step and also choose a particular step under Run till step then execution will run till the condition is met first. For example, if a failure is encountered first it will run till the step that fails, and vice versa.
If you enabled toggle Run till failed step then the debug point will appear at the failed step during test execution, if any. And, if you selected a step under 'Run till step', then a debug point will appear for that step.
- Configure the section Use Path/Use Uploads according to your setup.
- Once you have filled the required fields, click on the button Run Now on the bottom right of the Ad-hoc Run layover.
- Now the debugger screen will open where you will see the test steps, related information and the device screen. The device screen will display the current screen being under test. The screen will appear something like the screenshot below:
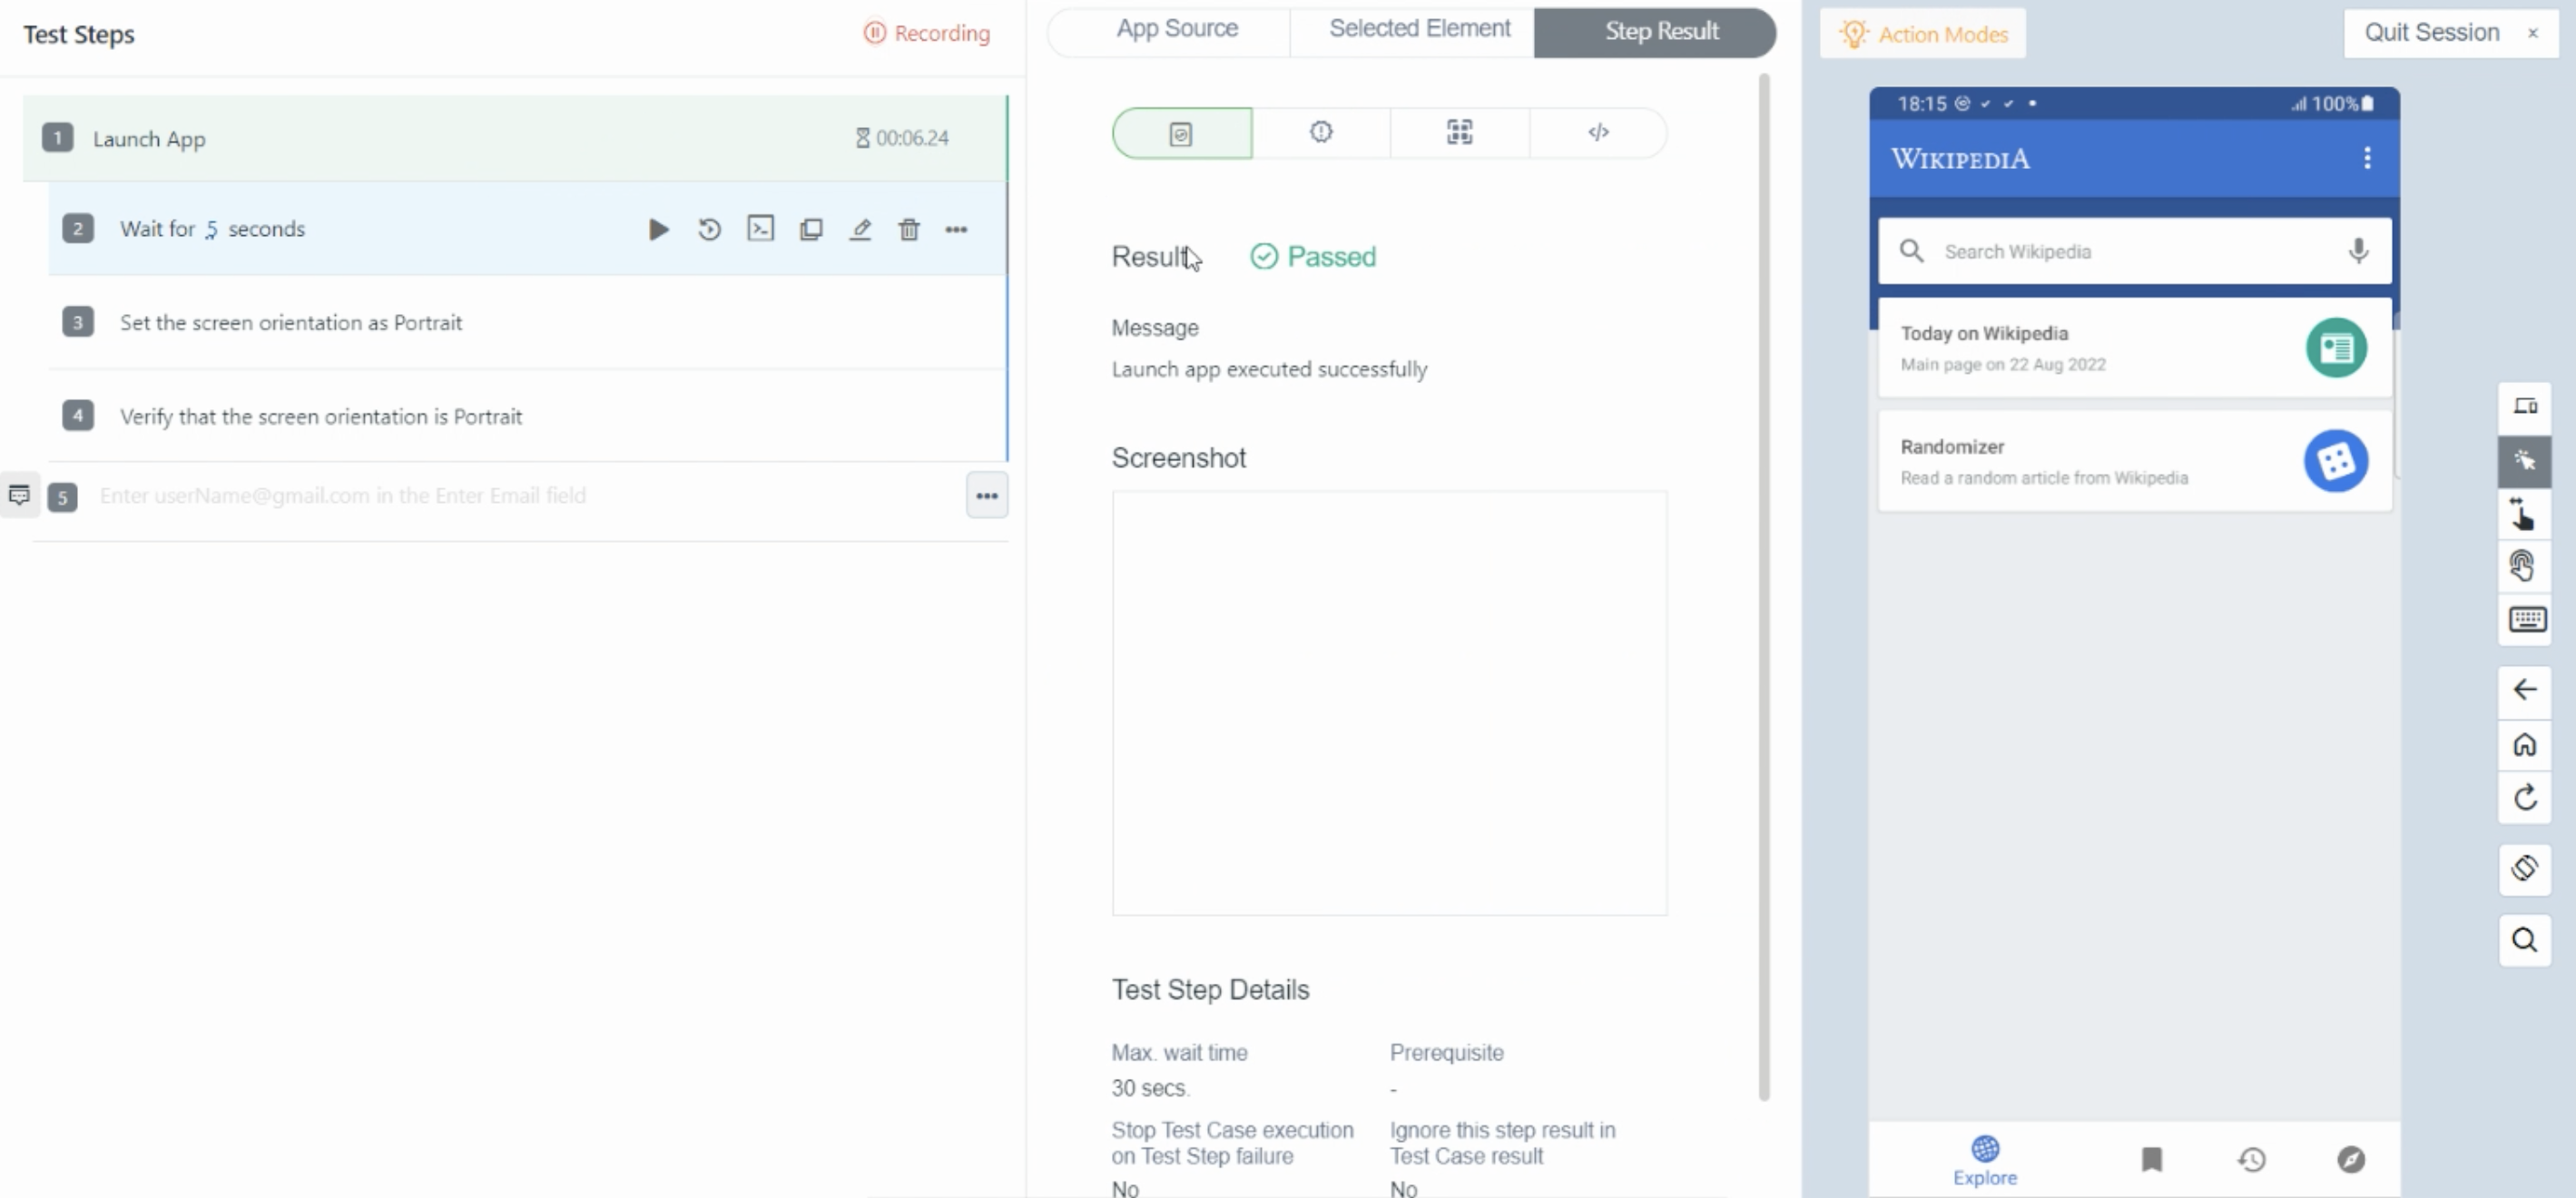
- On this screen you would be able to see the test execution. The enabled debug point will be displayed like the red icon highlighted in the screenshot below.
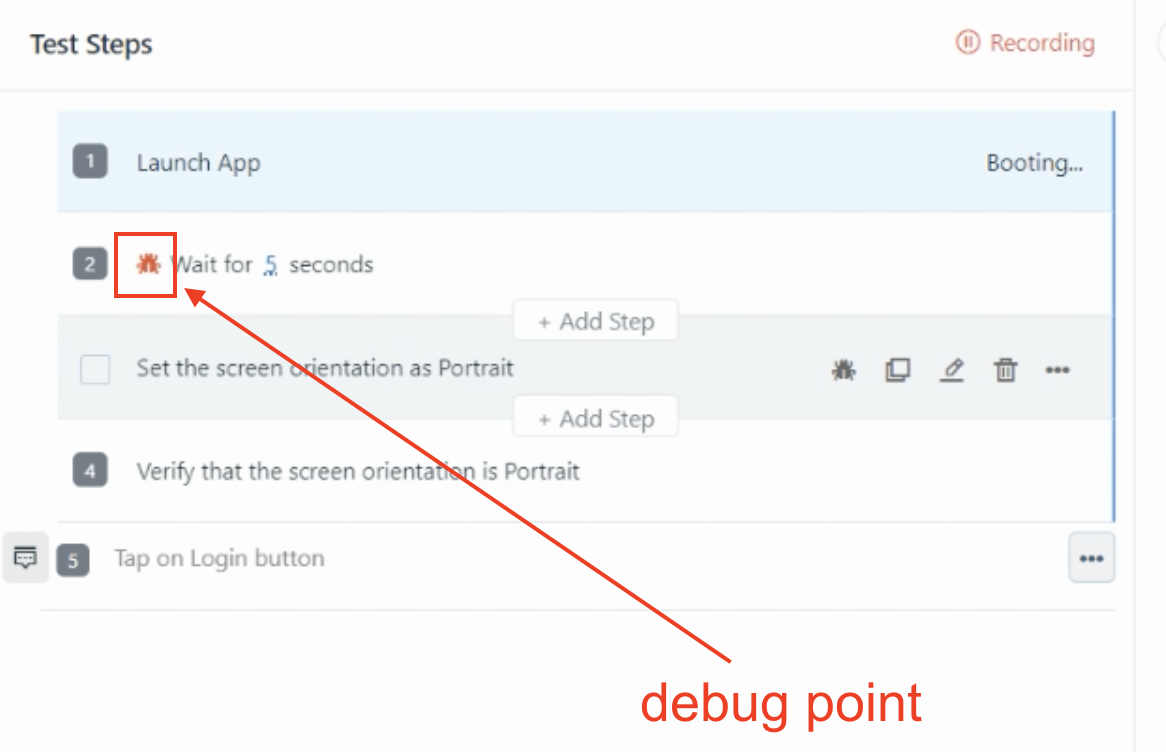
On this screen, the debug point can be enabled for any test step by hovering on the test step and clicking on the corresponding debug point that appears. When a debug point is enabled for a test step, the test execution will pause on reaching that step.
-
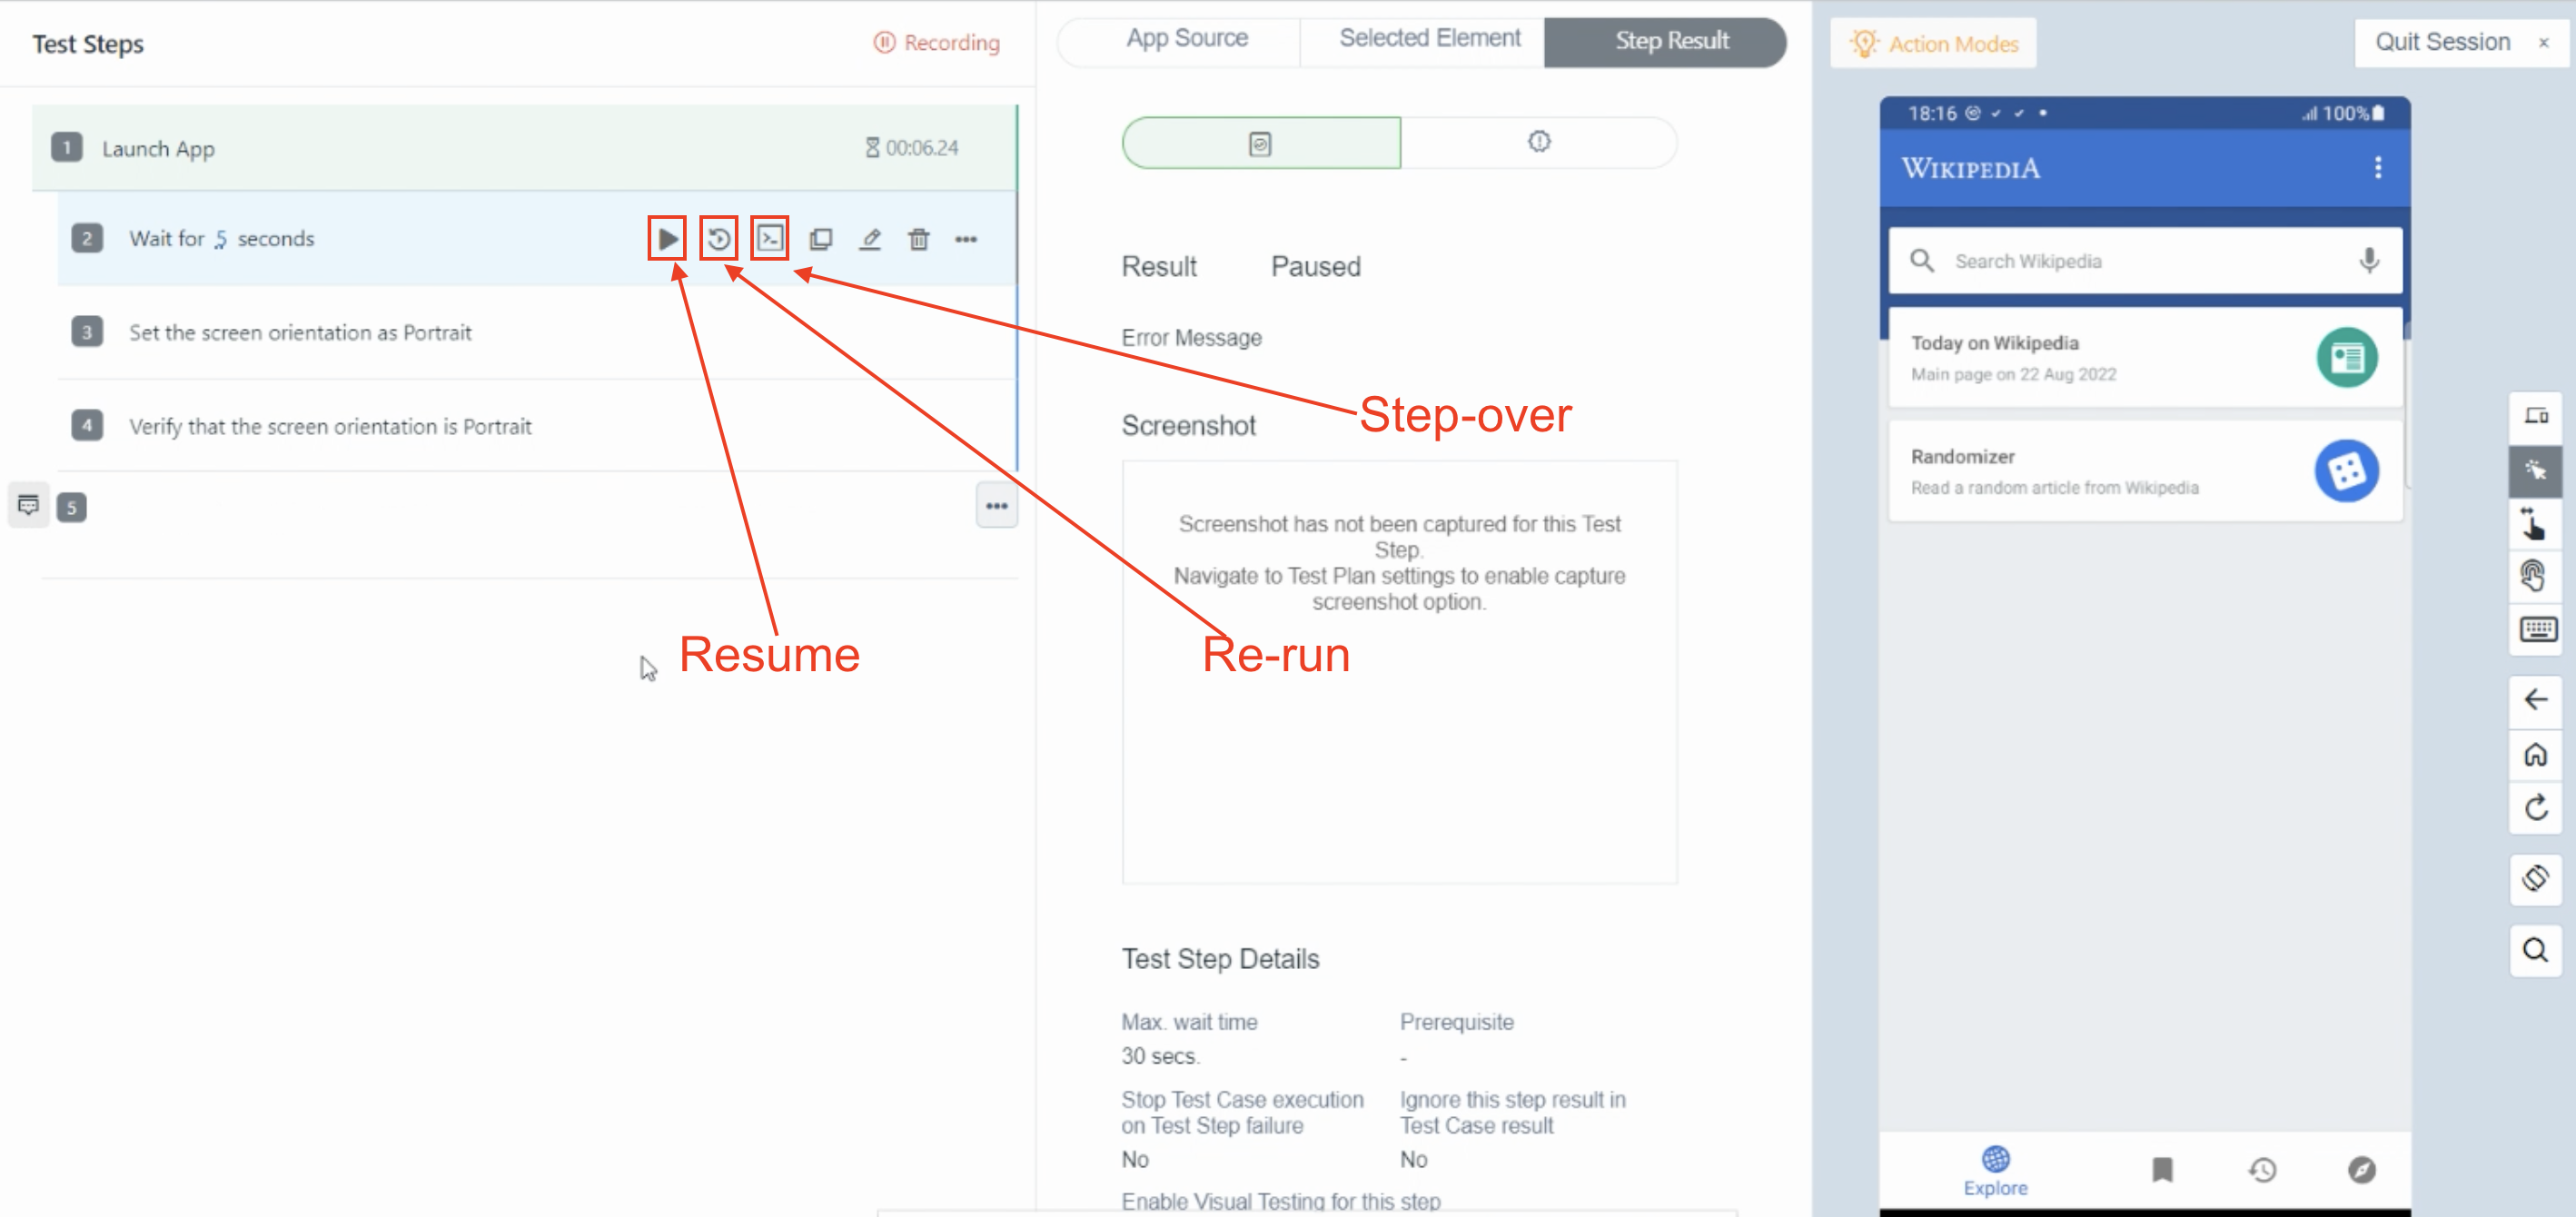
When the test execution pauses on any of these steps, you can check the related details under the section Add Source/Selected Element/Step Result. In addition, you see below options on the test step:
- Resume: To resume the test execution from that step.
- Rerun: To execute the selected step again.
- Step Over: To start debugging the next step. If you click on the “step over” button on a debug step, you will see that the debug point will appear for the next step. The execution control would move to the next step too.
The test step actions are highlighted in the screenshot below for your reference: